LANGUAGE:

- Contacts
- Support
- Offers
- Compatibility
- Services
- Products
- Datalogger and accessories
- String Control and String Box
- Enviromental Sensors
- Power supplies and Drains
- Power Supply DIN 24VDC 60W
- DIN POWER SUPPLY 24V, 4A, 100W
- POWER SUPPLY 10W 5V WALLMOUNT
- POWER SUPPLY 12V WALLMOUNT
- WALLMOUNT SUPPLY 24VDC, 1A, 24W
- SURGE RS485 OF OVERVOLTAGE
- SWITCHBOARD IP65 24VDC WITH 8 MODULES AND SURGE RS485
- SWITCHBOARD IP65 24VDC WITH 8 MODULES
- SWITCHBOARD IP65 24VDC WITH 12 MODULES AND SURGE RS485
- Networking
- AROS COMMUNICATION BOARD RS485 FOR INVERTER SIRIO LT
- AROS COMMUNICATION BOARD RS485 FOR SIRIO CENTRAL INVERTERS
- COMMUNICATIONS BOARD RS485 FOR SMC AND SUNNY BOY INVERTERS
- COMMUNICATIONS BOARD RS232 FOR SMC AND SUNNY BOY INVERTERS
- SERIAL CABLE BY DB9/M TO DB9/F
- ANTENNA SYSTEMS WIRELESS LAN 14dBi GAIN
- ACCESS POINT WIRELESS 150MB
- ACCESS POINT WIRELESS 300MB
- Counters and Digital/Analog Inputs
- Signal Converters
- LED Display
- LCD display
- SUNGUARD INFO DISPLAY 22''
- SUNGUARD INFO DISPLAY 22'' WIFI
- SUNGUARD INFO DISPLAY 32''
- SUNGUARD INFO DISPLAY 32'' WIFI
- SUNGUARD INFO DISPLAY 42''
- SUNGUARD INFO DISPLAY 42'' WIFI
- SUNGUARD INFO DISPLAY 52''
- SUNGUARD INFO DISPLAY 52'' WIFI
- SUNGUARD CONTROL DISPLAY 32''
- SUNGUARD CONTROL DISPLAY 32'' WIFI
- SUNGUARD CONTROL DISPLAY 42''
- SUNGUARD CONTROL DISPLAY 42'' WIFI
- SUNGUARD CONTROL DISPLAY 52''
- SUNGUARD CONTROL DISPLAY 52'' WIFI
- SUNGUARD VIDEO CONTROL
- SUNGUARD VIDEO CONTROL WIFI
- SUNGUARD VIDEO DISPLAY
- SUNGUARD VIDEO DISPLAY WIFI
- Tablet
- Signal Repeaters
- Solution
- Introduction to monitoring SunGuard
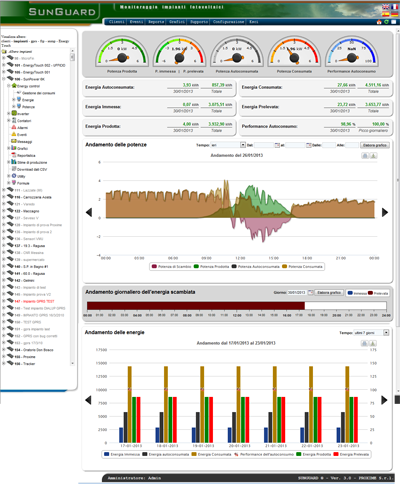
- Overview of the SunGuard interface web portal
- Self-consumption interface
- SunGuard Box
- SunGuard SensorBox
- Performance analysis and reporting system
- Information System and Data Access
- Choice of variables to be monitored
- Monitoring and management of energy saving
- SunGuard App for iPhone and iPad